Reprogramming roadmap reveals route to human induced trophoblast stem cells
In this tab, users can download processed datasets used in this work.
readySeu_hrpi.rds Ready-to-use Seurat object for sn/scRNA-seq reprogramming roadmap [Click here for Rmarkdown user guide]
readySeu_hrpi.rds Ready-to-use Seurat object for scRNA-seq RSeT reprogramming [Click here for Rmarkdown user guide]
readySeu_hrpi.rds Ready-to-use Seurat object for scRNA-seq day 21 intermediates [Click here for Rmarkdown user guide]
hrpiSN_barcodes.tsv.gz hrpiSN_features.tsv.gz hrpiSN_matrix.mtx.gz UMI matrix for snRNA-seq libraries (Cell Ranger / MEX format)
hrpiSC_barcodes.tsv.gz hrpiSC_features.tsv.gz hrpiSC_matrix.mtx.gz UMI matrix for scRNA-seq libraries (Cell Ranger / MEX format)
bkRNA_rawCts.tab.gz Raw counts matrix for bulk RNA-seq libraries
bkRNA_logFPKM.tab.gz log2(FPKM + 1) matrix for bulk RNA-seq libraries
bkATACtss.tab.gz log2(FPKM + 1) matrices of ATAC-seq peaks nearest to each gene's TSS
rsetSC_barcodes.tsv.gz rsetSC_features.tsv.gz rsetSC_matrix.mtx.gz UMI matrix for scRNA-seq libraries (Cell Ranger / MEX format)
bkATAC_annotated_clusters.Rdata bkATAC_gene_z_scores_bkRNA_seq.Rdata Annotated ATAC-seq clusters and expression of associated genes
bkATAC_motif_enrichment.Rdata bkATAC_gata2.ap2.gamma.motif.enrichment.Rdata Top 25 most enriched motifs accross clusters and GATA2/TFAP2C enrichment
d21iSC_barcodes.tsv.gz d21iSC_features.tsv.gz d21iSC_matrix.mtx.gz UMI matrix for scRNA-seq libraries (Cell Ranger / MEX format)
tscRNA_rawCts.tab.gz Raw counts matrix for bulk RNA-seq libraries
tscRNA_logFPKM.tab.gz log2(FPKM + 1) matrix for bulk RNA-seq libraries
tscExt_OkaeLogFPKM.tab.gz tscExt_DongLogFPKM.tab.gz log2(FPKM + 1) matrices for published TSC datasets
petSignatures_suppTable12.tab Early embryonic development (TE / EPI / PE) signatures from Petroupolos 2016 (Supplementary Table 12)
Ready-to-use Seurat Objects
Apart from our interactive web application, users who are more adept with the R programming language can download our ready-to-use Seurat objects to further interrogate the rich single-cell data generated in this work. An accompanying Rmarkdown user guide is provided with some examples on how to use these Seurat objects.readySeu_hrpi.rds Ready-to-use Seurat object for sn/scRNA-seq reprogramming roadmap [Click here for Rmarkdown user guide]
readySeu_hrpi.rds Ready-to-use Seurat object for scRNA-seq RSeT reprogramming [Click here for Rmarkdown user guide]
readySeu_hrpi.rds Ready-to-use Seurat object for scRNA-seq day 21 intermediates [Click here for Rmarkdown user guide]
Data for sn/scRNA-seq reprogramming roadmap
hrpi_colData_suppTable01.tab Metadata for each single cell in the sn/scRNA-seq reprogramming roadmap (Supplementary Table 1)hrpiSN_barcodes.tsv.gz hrpiSN_features.tsv.gz hrpiSN_matrix.mtx.gz UMI matrix for snRNA-seq libraries (Cell Ranger / MEX format)
hrpiSC_barcodes.tsv.gz hrpiSC_features.tsv.gz hrpiSC_matrix.mtx.gz UMI matrix for scRNA-seq libraries (Cell Ranger / MEX format)
Data for bulk RNA-seq reprogramming intermediates
bkRNA_colData_suppTable05.tab Metadata for each sample in the bulk RNA-seq of reprogramming intermediates (Supplementary Table 5)bkRNA_rawCts.tab.gz Raw counts matrix for bulk RNA-seq libraries
bkRNA_logFPKM.tab.gz log2(FPKM + 1) matrix for bulk RNA-seq libraries
bkATACtss.tab.gz log2(FPKM + 1) matrices of ATAC-seq peaks nearest to each gene's TSS
Data for scRNA-seq RSeT reprogramming
rsetSC_colData_suppTable06.tab Metadata for each single cell in the scRNA-seq of RSeT reprogramming (Supplementary Table 6)rsetSC_barcodes.tsv.gz rsetSC_features.tsv.gz rsetSC_matrix.mtx.gz UMI matrix for scRNA-seq libraries (Cell Ranger / MEX format)
Data for bulk ATAC-seq reprogramming intermediates
bkATAC_consensus_peak_set_counts.txt seed.Rdata ATAC-seq consensus peak set counts and seed used for fuzzy clusteringbkATAC_annotated_clusters.Rdata bkATAC_gene_z_scores_bkRNA_seq.Rdata Annotated ATAC-seq clusters and expression of associated genes
bkATAC_motif_enrichment.Rdata bkATAC_gata2.ap2.gamma.motif.enrichment.Rdata Top 25 most enriched motifs accross clusters and GATA2/TFAP2C enrichment
Data for scRNA-seq day 21 intermediates
d21iSC_colData_suppTable13.tab Metadata for each single cell in the scRNA-seq of day 21 intermediates (Supplementary Table 13)d21iSC_barcodes.tsv.gz d21iSC_features.tsv.gz d21iSC_matrix.mtx.gz UMI matrix for scRNA-seq libraries (Cell Ranger / MEX format)
Data for bulk RNA-seq TSC-related samples
tscRNA_colData_suppTable14.tab Metadata for each sample in the bulk RNA-seq of TSC-related samples (Supplementary Table 14)tscRNA_rawCts.tab.gz Raw counts matrix for bulk RNA-seq libraries
tscRNA_logFPKM.tab.gz log2(FPKM + 1) matrix for bulk RNA-seq libraries
tscExt_OkaeLogFPKM.tab.gz tscExt_DongLogFPKM.tab.gz log2(FPKM + 1) matrices for published TSC datasets
Gene signatures
geneSignatures_suppTable03.tab Eight gene signatures defined in this study (primed / naive / nis / fibroblast etc.) (Supplementary Table 3)petSignatures_suppTable12.tab Early embryonic development (TE / EPI / PE) signatures from Petroupolos 2016 (Supplementary Table 12)
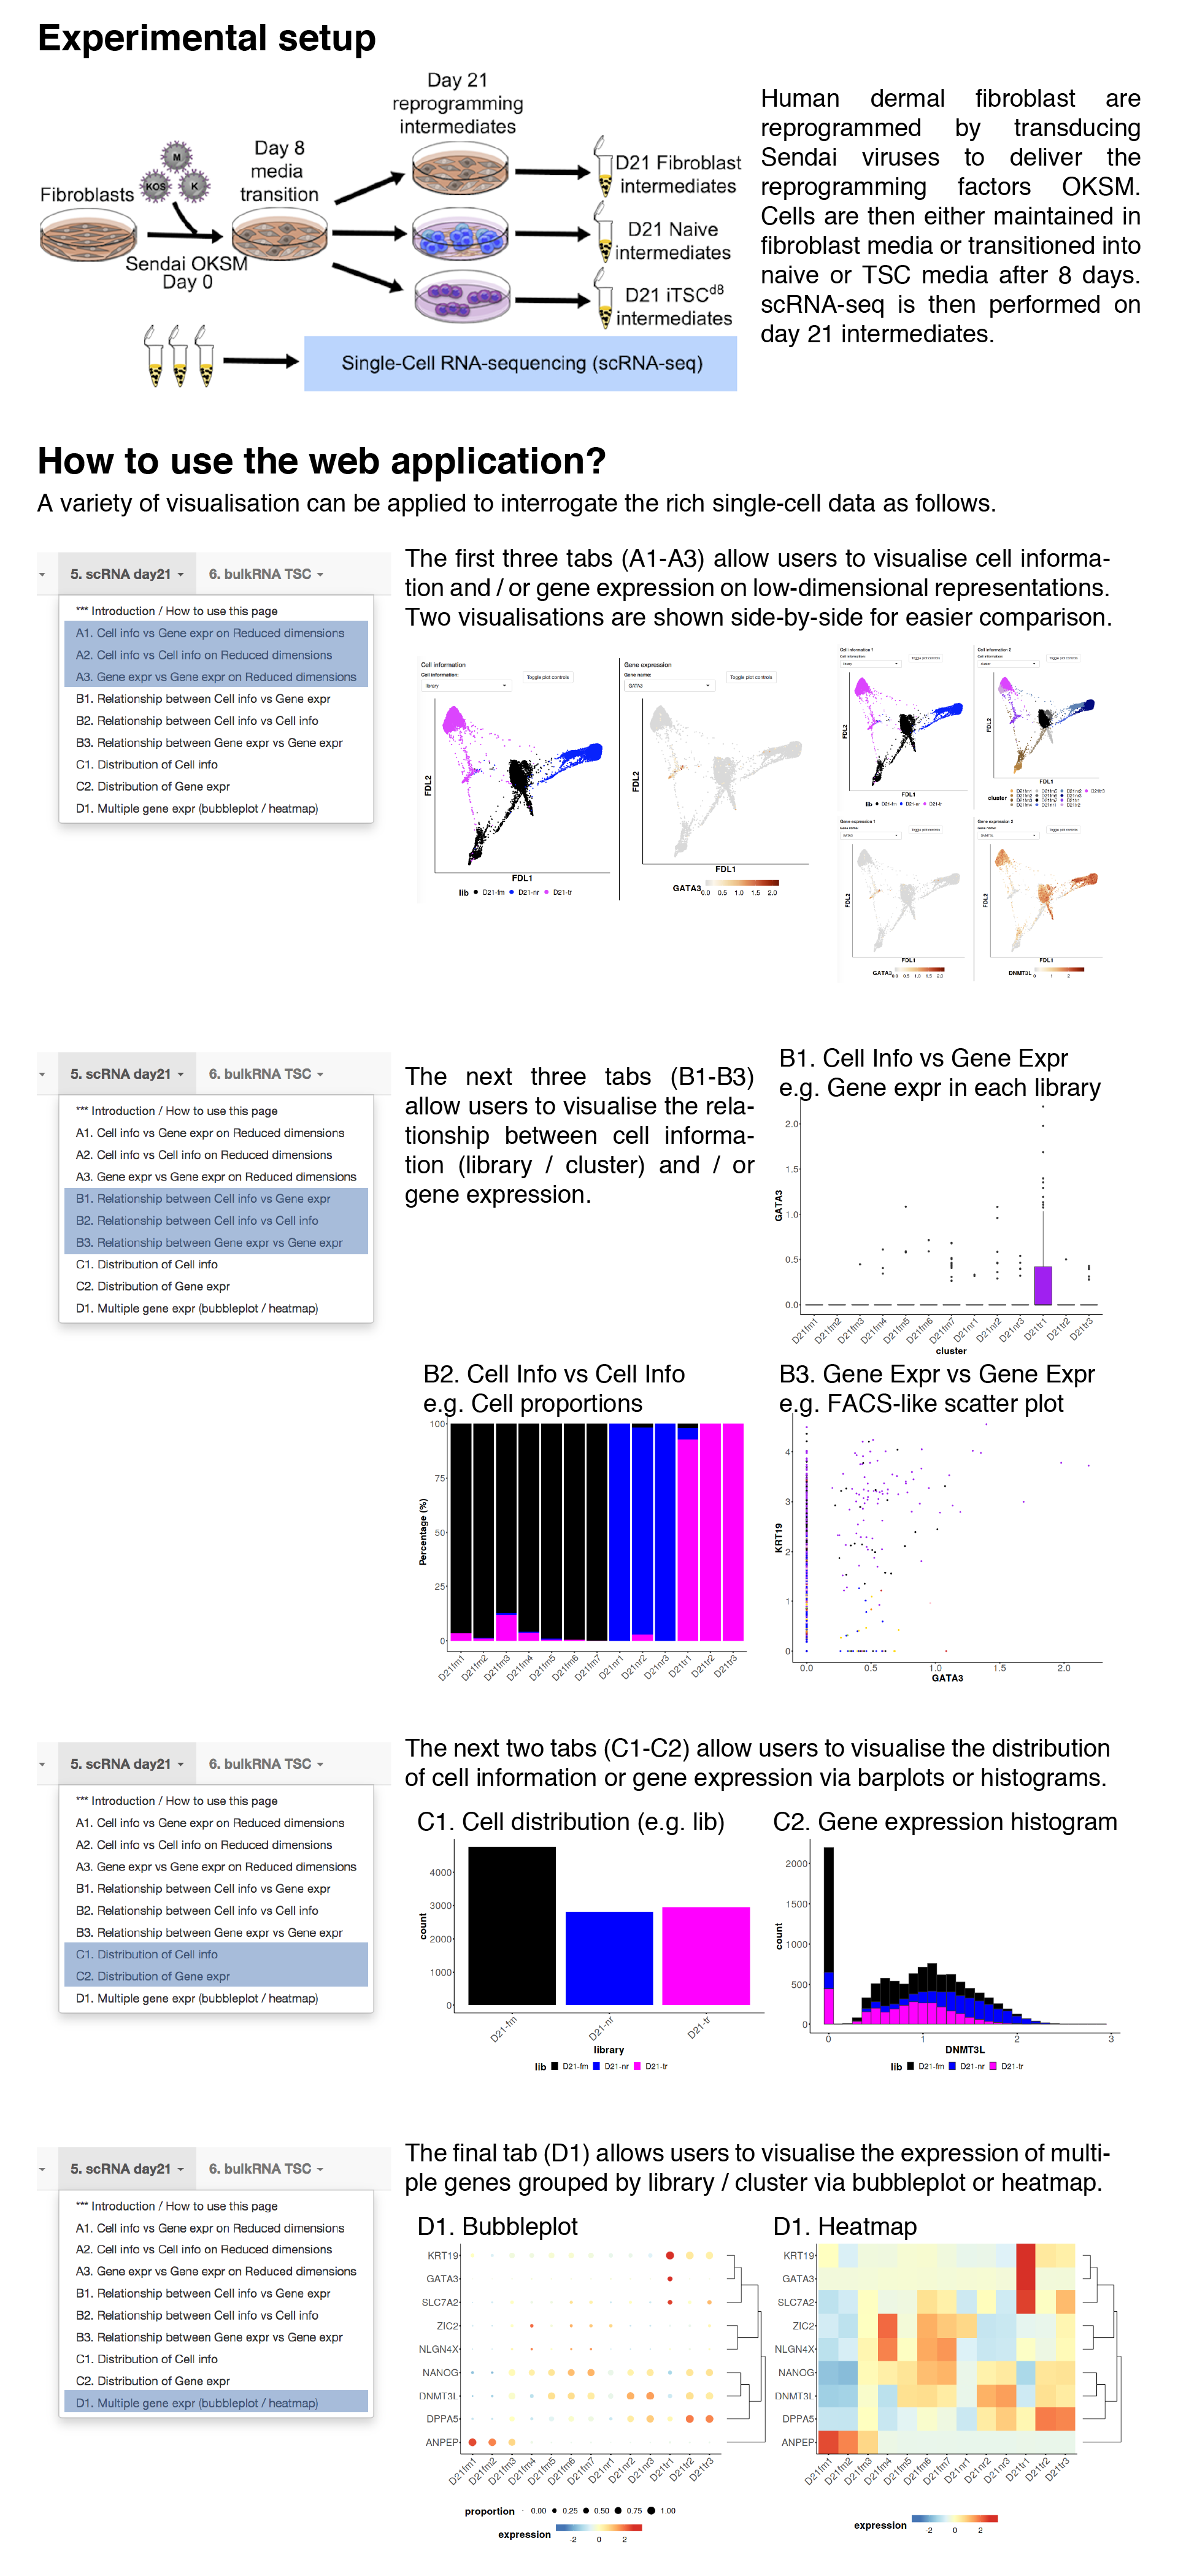
Cell information vs gene expression on reduced dimensions
In this tab, users can visualise both cell information and gene expression side-by-side on different low-dimensional representions.Dimension Reduction
Cell information
Gene expression
Cell information vs cell information on dimension reduction
In this tab, users can visualise two cell informations side-by-side on different low-dimensional representions.Dimension Reduction
Cell information 1
Cell information 2
Gene expression vs gene expression on dimension reduction
In this tab, users can visualise two gene expressions side-by-side on different low-dimensional representions.Dimension Reduction
Gene expression 1
Gene expression 2
Relationship between cell information and gene expression
In this tab, users can visualise the relationship between cell information (discrete covariates) and gene expression.Usage examples include the distribution of gene expression across libaries / clusters.
Relationship between cell information 1 and 2
In this tab, users can visualise the composition of single cells based on one cell information (discrete covariates) across another cell information.Usage examples include the library or cellcycle composition across clusters.
Relationship between gene expression 1 and 2
In this tab, users can visualise the coexpression of two genes.Users can also colour the single cells by cell information.
Distribution of cell information
In this tab, users can visualise the distribution (no. cells), grouped by cell information.Barplot and histogram are plotted for discrete and continuous covariates respectively.
Distribution of gene expression
In this tab, users can visualise the distribution of gene expression.Gene expression bubbleplot / heatmap
In this tab, users can visualise the gene expression patterns of multiple genes grouped by cell information (e.g. library / cluster).The normalised expression are averaged, log-transformed and then plotted.
3D PCA plots
In this tab, users can visualise the 3D principal component analysis (PCA) of the reprogramming trajectory.Each point represent a biological replicates while trajectories (black/orange/blue lines) are drawn by connecting the averaged PCs for each timepoint.
Gene expression with respect to media and timepoint
In this tab, users can visualise the gene expression pattern during reprog.FPKMs are averaged across biological replicates, log2-transformed and then plotted.
Gene signature with respect to media and timepoint
In this tab, users can visualise the gene signature pattern during reprog.Gene expression heatmap for reprogramming intermediates
In this tab, users can visualise the gene expression patterns of multiple genes during reprogramming via heatmap.The FPKMs are averaged across biological replicates, log2-transformed and then plotted.
Cell information vs gene expression on dimension reduction
In this tab, users can visualise both cell information and gene expression side-by-side on different low-dimensional representions.Dimension Reduction
Cell information
Gene expression
Cell information vs cell information on dimension reduction
In this tab, users can visualise two cell informations side-by-side on different low-dimensional representions.Dimension Reduction
Cell information 1
Cell information 2
Gene expression vs gene expression on dimension reduction
In this tab, users can visualise two gene expressions side-by-side on different low-dimensional representions.Dimension Reduction
Gene expression 1
Gene expression 2
Relationship between cell information and gene expression
In this tab, users can visualise the relationship between cell information (discrete covariates) and gene expression.Usage examples include the distribution of gene expression across libaries / clusters.
Relationship between cell information 1 and 2
In this tab, users can visualise the composition of single cells based on one cell information (discrete covariates) across another cell information.Usage examples include the library or cellcycle composition across clusters.
Relationship between gene expression 1 and 2
In this tab, users can visualise the coexpression of two genes.Users can also colour the single cells by cell information.
Distribution of cell information
In this tab, users can visualise the distribution (no. cells), grouped by cell information.Barplot and histogram are plotted for discrete and continuous covariates respectively.
Distribution of gene expression
In this tab, users can visualise the distribution of gene expression.Gene expression bubbleplot / heatmap
In this tab, users can visualise the gene expression patterns of multiple genes grouped by cell information (e.g. library / cluster).The normalised expression are averaged, log-transformed and then plotted.
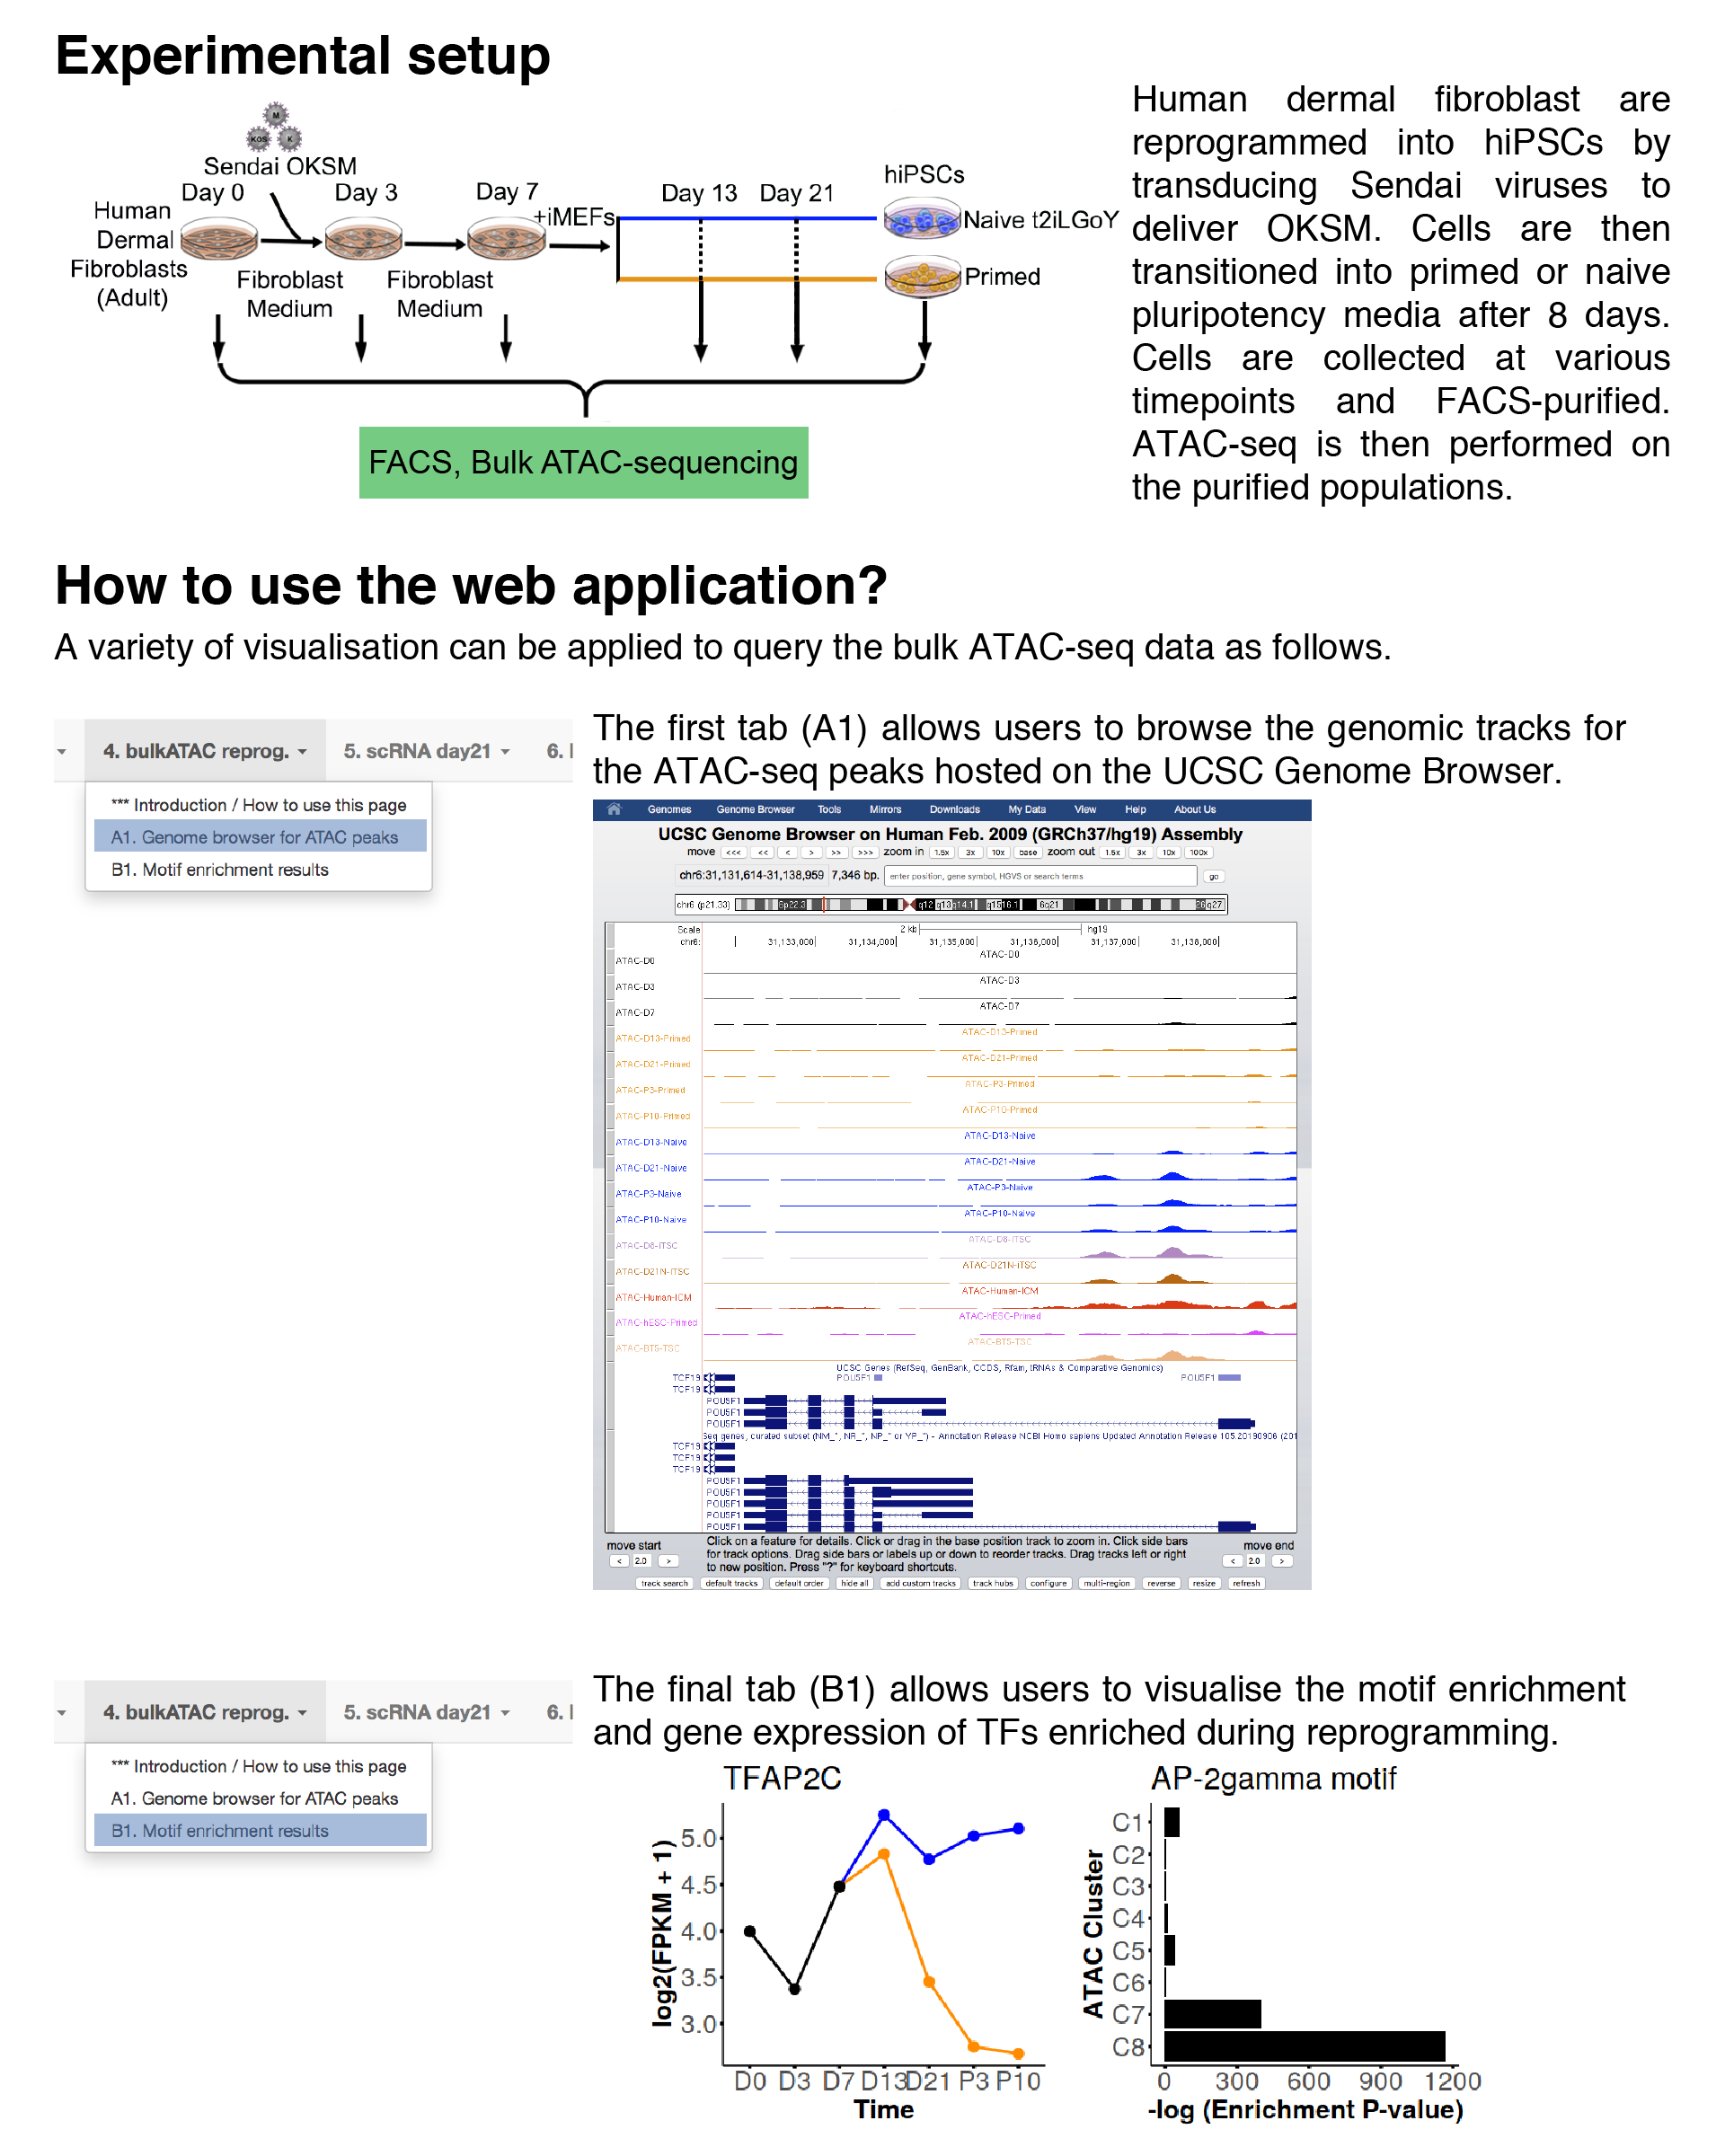
Genome browser for ATAC peaks
In this tab, users can visualise the genomic tracks for ATAC-seq peaks.Note: The ATAC-seq tracks are hosted on an external UCSC genome browser and may take a while to load. Please be patient.
Motif enrichment results
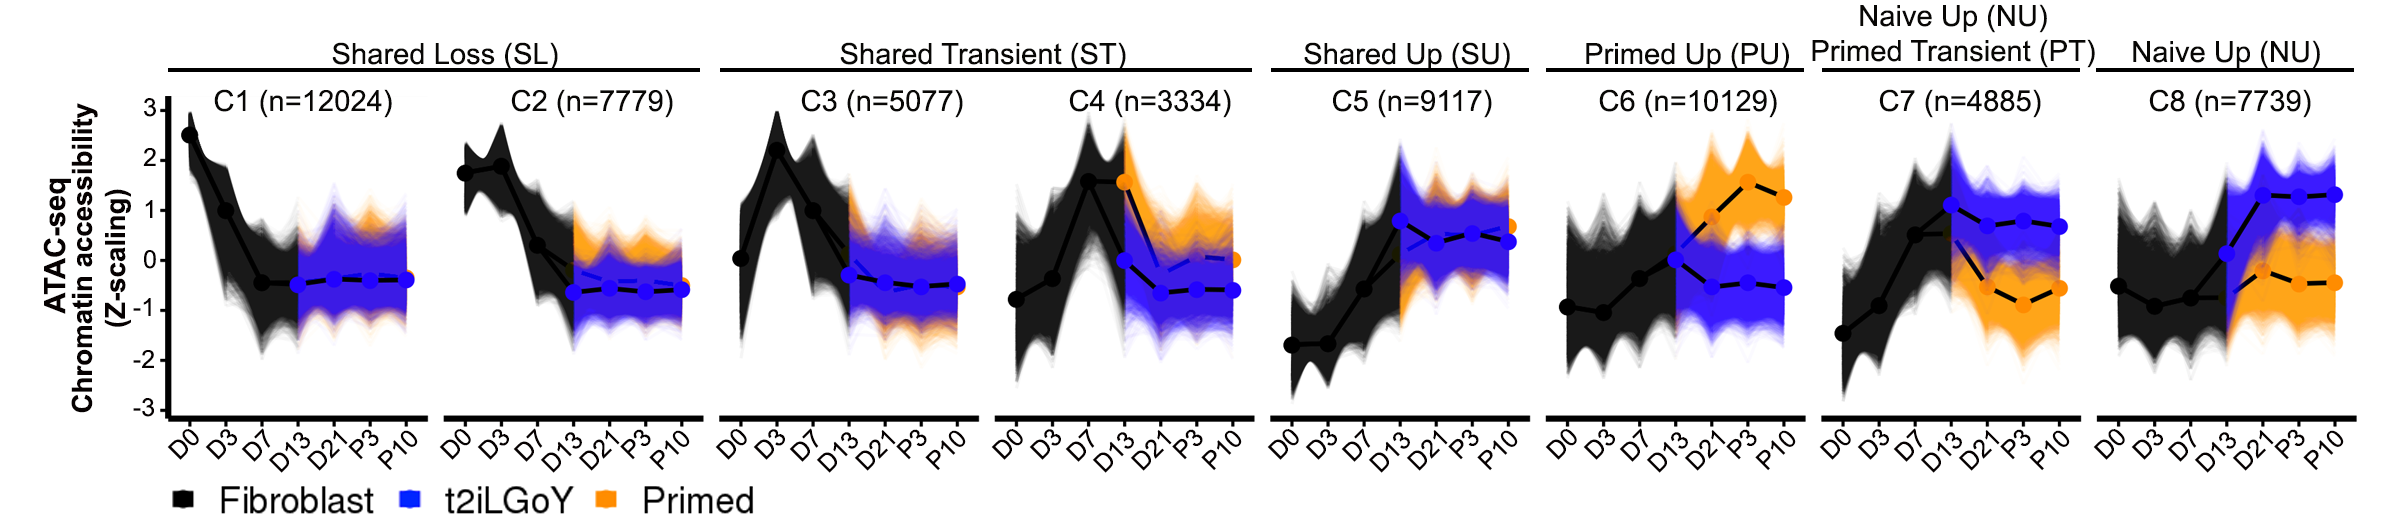
In this tab, users can visualise the motif enrichment and gene expression of TFs enriched during reprogramming.ATAC-seq chromatin accessibility clusters (reproduced from paper)
Gene expression
Motif enrichment
Cell information vs gene expression on dimension reduction
In this tab, users can visualise both cell information and gene expression side-by-side on different low-dimensional representions.Dimension Reduction
Cell information
Gene expression
Cell information vs cell information on dimension reduction
In this tab, users can visualise two cell informations side-by-side on different low-dimensional representions.Dimension Reduction
Cell information 1
Cell information 2
Gene expression vs gene expression on dimension reduction
In this tab, users can visualise two gene expressions side-by-side on different low-dimensional representions.Dimension Reduction
Gene expression 1
Gene expression 2
Relationship between cell information and gene expression
In this tab, users can visualise the relationship between cell information (discrete covariates) and gene expression.Usage examples include the distribution of gene expression across libaries / clusters.
Relationship between cell information 1 and 2
In this tab, users can visualise the composition of single cells based on one cell information (discrete covariates) across another cell information.Usage examples include the library or cellcycle composition across clusters.
Relationship between gene expression 1 and 2
In this tab, users can visualise the coexpression of two genes.Users can also colour the single cells by cell information.
Distribution of cell information
In this tab, users can visualise the distribution (no. cells), grouped by cell information.Barplot and histogram are plotted for discrete and continuous covariates respectively.
Distribution of gene expression
In this tab, users can visualise the distribution of gene expression.Gene expression bubbleplot / heatmap
In this tab, users can visualise the gene expression patterns of multiple genes grouped by cell information (e.g. library / cluster).The normalised expression are averaged, log-transformed and then plotted.
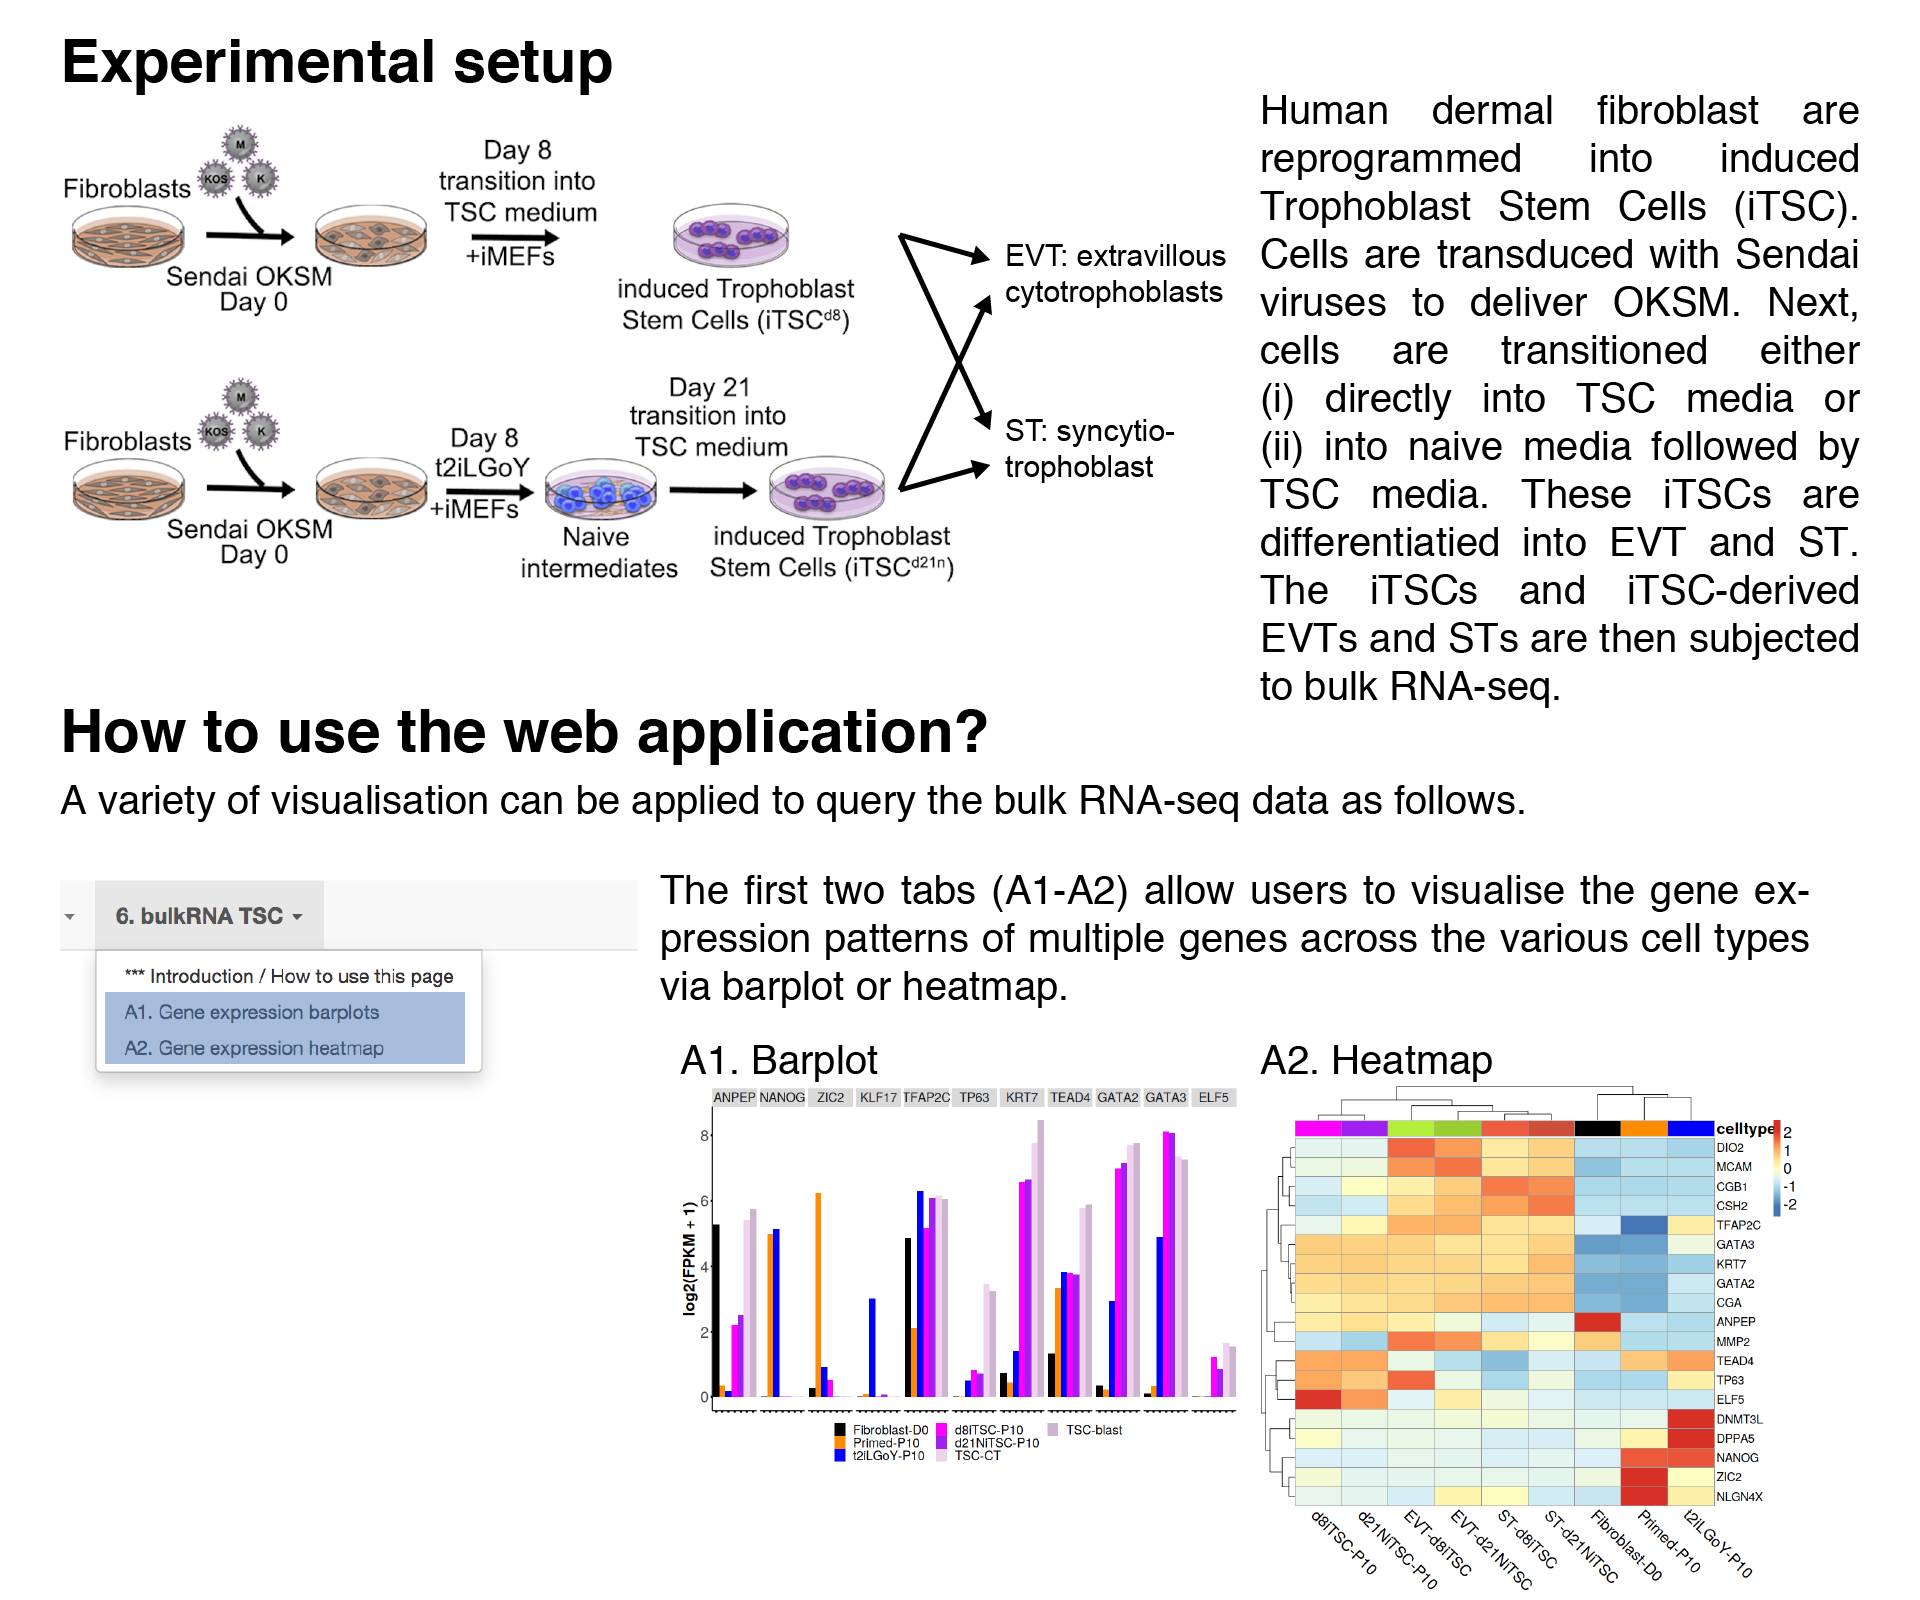
Gene expression barplots
In this tab, users can visualise the gene expression patterns of multiple genes across the various cell types via barplot.The FPKMs are averaged across biological replicates, log2-transformed and then plotted.
Note: RNA-seq samples from Okae et al. (Cell Stem Cell, 2018) are included for comparison, which include: TSC-CT, TSC-blast, EVT-TSC, ST-TSC.
Gene expression heatmap
In this tab, users can visualise the gene expression patterns of multiple genes across the various cell types via heatmap.The FPKMs are averaged across biological replicates, log2-transformed and then plotted.
Reference: Liu X., Ouyang J.F., Rossello F.J. et al. Reprogramming roadmap reveals route to human induced trophoblast stem cells Nature 586, 101-107 (2020) doi:10.1038/s41586-020-2734-6